


Dorset is a popular place for retirees to move to over other age groups, new census data reveals.
Following the publication of the 2021 Census, we compared this data with that of the 2011 Census to learn more about how the demographics of the Dorset area have changed over the past decade.
In particular, we compared the 2011 and 2021 data to learn more about the age groups living in each County/Local Authority. By analysing this, we have been able to deduce whether each age group has increased or decreased in those areas over the last ten years.
How the Census Data was Gathered
The age groups in the Census data increase by 5-year increments. For greater clarity, we have grouped these age groups further, by the following:
- 0-19 year olds
- 20-39 year olds
- 40-64 year olds
- 65+ year olds
The data collected shows both ‘Local Authority’ and ‘County’ data. Counties are normally considered to be a large area, with various Local Authority jurisdictions within them.
However, since 2011, Dorset has become a singular Local Authority, grouping the following Local Authorities under the Dorset umbrella:
- East Dorset
- North Dorset
- Purbeck
- West Dorset
- Weymouth and Portland
Similarly, Bournemouth, Christchurch and Poole used to each be their own Local Authority in 2011, but are now grouped together in 2021.
Because of these changes, we have grouped the 2011 data so we can compare it to the 2021 data clearly.
Dorset as a county also contains Bournemouth, Christchurch and Poole. So, we have Dorset (Local Authority) and Dorset (County) meaning 2 different areas of land.
Key Data From the 2011 and 2021 Census’
The key data from the comparison of the 2011 and 2021 Census’ is Dorset’s shift in popularity among 65+ year olds.
There are a number of key statistics that demonstrate this shift. Firstly, Bournemouth, Christchurch and Poole, and Dorset (as a Local Authority) have all seen a slight decrease in the number of 20-39 year old residents since 2011 (1%). By way of contrast, Bournemouth, Christchurch and Poole has seen a slight increase of 2% in 65+ year-old residents, while Dorset (as a Local Authority) has seen an increase of 5%.
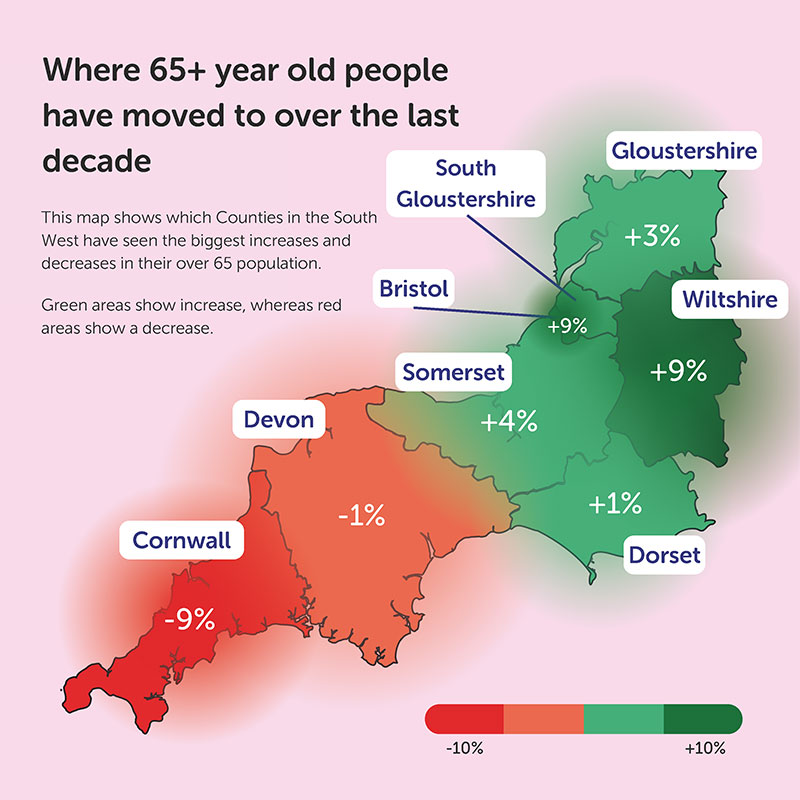
This is particularly interesting in comparison with the rest of the South West.
- Cornwall, 16%
- South Gloucestershire, 4%
- Dorset (County), 3%
- Devon, 2%
- Somerset, 0%
- Gloucestershire, 0%
- Wiltshire, -2%
- City of Bristol, -10%
- Wiltshire, 9%
- City of Bristol, 9%
- Somerset, 4%
- Gloucestershire, 3%
- South Gloucestershire, 2%
- Dorset (County), 1%
- Devon, -1%
- Cornwall, -9%
Explaining the Dorset Census Data
So, what does the data from the 2011 and 2021 Census’ tell us? There are several potential explanations which may have a bearing on the patterns we have been able to spot in the data.
The first is the dramatic shift in the demographic outlook of Cornwall. From 2011 to 2021, Cornwall saw a large increase in the number of 20-39 year olds (16%), while the number of 65+ year olds decreased by 9%. There was also an 8% increase in the number of 40-64 year olds in Cornwall.
Similarly, there was a 12% increase in 20-39 year olds in the Isle of Wight, and a 10% decrease in 65+ residents here, as well as a 6% increase of 20-39 year olds in Torbay and an 8% decrease of 65+ year olds. This raises a valid question as to whether this increase in young people in Cornwall, Torbay, and the Isle of Wight is encouraging 65+ year olds to move to Dorset instead.
The cost of living in Dorset is another potential explanation for the trends on show. In comparison with the rest of the UK, Dorset is above average when it comes to aspects like the average cost of house prices.
The average residential property price in Dorset over the past year sits at £372,374, compared to the average UK property price of £281,000, as per April 2022.
This is also combined with the fact that the average salary ranges between £31,400 in Dorset and £31,700 in Bournemouth, Christchurch and Poole. These figures are below the national average of £38,100.
These combined issues may suggest that it is more difficult for younger people to afford to live in Dorset, whereas those who are retired and have a higher net worth may see the area as a more attractive prospect.
Want to Retire to Dorset?
The first release of the 2021 census data has demonstrated some clear trends in both the South West region, and Dorset specifically.
If you’d like to join the growing retiree community in this coastal county, be sure to get in touch with the Frettens conveyancing team by calling 01202 499255, or heading to the residential property page for more information. We look forward to helping you find a place to retire.
Methodology
The data presented in this article has been taken from the Office for National Statistics 2011 and 2021 Census results.
To work out the percentage of residents for each age group in a certain location, we worked out the sum of people in that age group divided by the total population of people in that location. We did this for both the 2011 data and the 2021 data.
Then, to work out the percentage increase/decrease of people in that age group in each location between 2011 and 2021, we worked out the difference between the percentages for 2021 and 2011.
Although this data was sourced via reputable sources, its interpretations are that of the Frettens researchers.
Data Sources
- Population and household estimates, England and Wales: Census 2021 from Office for National Statistics
- 2011 Census: Population Estimates by five-year age bands, and Household Estimates, for Local Authorities in the United Kingdom from Office for National Statistics
- House prices in Dorset from Rightmove
- UK House price index: April 2022 from Office for National Statistics
- Dorset average salary comparison from Plumplot
Comments